
Confidence Interval Calculator
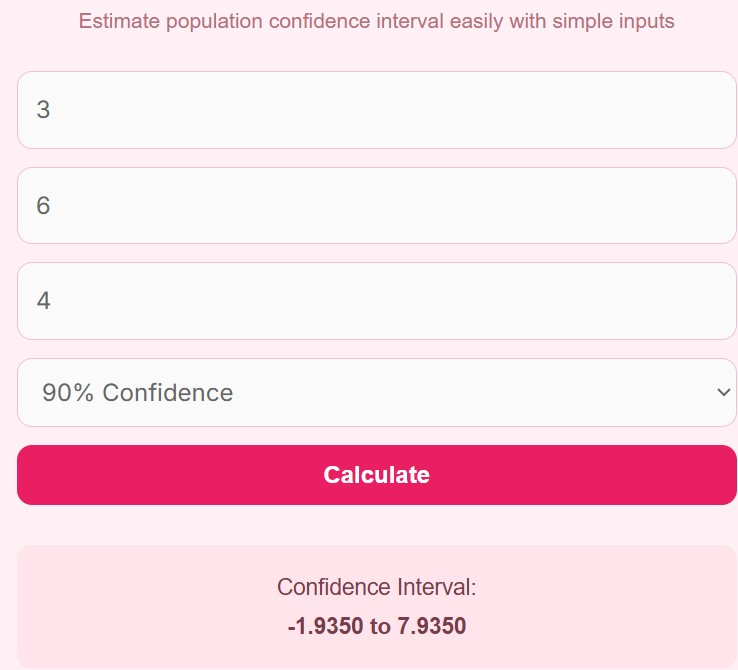
Estimate population confidence interval easily with simple inputs
What is Confidence Interval Calculator?
A Confidence Interval Calculator is a statistical tool used to estimate the range within which a population parameter (such as a mean) is likely to fall, based on sample data. In simple terms, it helps you understand how reliable your sample results are when applied to a larger population. Instead of relying on a single value, this calculator provides a range of possible values, known as the confidence interval.
This tool is widely used in statistics, research, business analytics, data science, healthcare studies, and academic experiments. It helps researchers and analysts make more informed decisions by showing the level of uncertainty in their estimates.
For example, if a survey shows that the average height of students is 170 cm, the confidence interval might show that the true average is likely between 168 cm and 172 cm with 95% confidence. This means the result is not exact but statistically reliable within a defined range.
A Confidence Interval Calculator typically uses three key inputs:
- Sample Mean
- Standard Deviation
- Sample Size
It then applies a confidence level (commonly 90%, 95%, or 99%) to calculate the range.
How to Use Confidence Interval Calculator
Using a Confidence Interval Calculator is simple, even for beginners. Follow these steps:
1. Enter Sample Mean
Input the average value from your dataset. This is the central value around which the interval is calculated.
2. Enter Standard Deviation
This shows how spread out your data is. A higher standard deviation means more variability in the dataset.
3. Enter Sample Size
Add the number of observations or data points you collected.
4. Select Confidence Level
Choose a confidence level such as 90%, 95%, or 99%. A higher confidence level gives a wider interval.
5. Click Calculate
The calculator will instantly display the confidence interval range.
The result will show something like:
Confidence Interval: 168.2 to 171.8
This means the true population mean is expected to lie within this range.
Advantages of Confidence Interval Calculator
A Confidence Interval Calculator offers many benefits, especially for researchers and data analysts:
1. Improves Decision Making
It provides a range instead of a single value, helping users make more accurate and reliable decisions.
2. Reduces Uncertainty
It clearly shows the level of uncertainty in statistical estimates, making data interpretation more realistic.
3. Saves Time
Manual calculations can be complex and time-consuming. The calculator gives instant results.
4. Useful in Research and Analysis
It is widely used in academic research, surveys, and scientific studies to validate results.
5. Easy to Use
Even beginners without advanced statistical knowledge can use it easily.
6. Supports Business Insights
Businesses use confidence intervals for market research, customer analysis, and forecasting.
7. Enhances Data Accuracy
It helps identify how close the sample result is to the actual population value.
FAQs (Frequently Asked Questions)
1. What is a confidence interval in simple words?
A confidence interval is a range of values that is likely to contain the true value of a population parameter.
2. Why do we use a Confidence Interval Calculator?
It helps estimate uncertainty in data and provides a reliable range instead of a single estimate.
3. What is the best confidence level to use?
The most commonly used confidence level is 95%, as it provides a balanced level of accuracy and reliability.
4. Can I use this calculator for small sample sizes?
Yes, but results may be less accurate. Larger sample sizes generally provide better estimates.
5. What does a wider confidence interval mean?
A wider interval indicates more uncertainty in the data, while a narrower interval means more precision.
6. Is this calculator useful for students?
Yes, it is highly useful for students studying statistics, economics, or research-based subjects.
Disclaimer
This calculator provides statistical estimates based on input data and assumptions.
Results should not be considered exact values but rather approximate ranges for analysis purposes.