
Least Squares Regression Line Calculator
What is Least Squares Regression Line Calculator?
A Least Squares Regression Line Calculator is an online statistical tool that helps determine the best-fit straight line for a set of data points. This line, known as the regression line, represents the relationship between two variables and is widely used in statistics, data science, economics, and machine learning.
The least squares method works by minimizing the sum of the squared differences between the actual data points and the predicted values on the regression line. In simple terms, it finds the line that fits the data points as closely as possible.
This regression line is commonly written in the slope-intercept form, where the line is represented by a mathematical equation.
In this equation:
y represents the predicted value
x represents the independent variable
m represents the slope of the line
b represents the y-intercept
The slope shows how much the value of y changes when x increases, while the intercept indicates where the line crosses the y-axis.
A Least Squares Regression Line Calculator automatically computes these values using your dataset. Instead of performing complex calculations manually, users simply enter the X and Y values, and the calculator instantly determines the slope, intercept, and regression equation.
This tool is extremely useful for students, researchers, analysts, and professionals who want to analyze relationships between variables quickly and accurately.
How to Use Least Squares Regression Line Calculator
Using the Least Squares Regression Line Calculator is simple and requires only a few steps. The calculator processes your dataset and provides the regression equation within seconds.
1. Enter X Values
First, input the values of the independent variable (X). These represent the factor that influences the outcome.
For example, X values might represent:
Time
Temperature
Advertising budget
Study hours
2. Enter Y Values
Next, input the corresponding dependent variable (Y) values. These are the outcomes affected by the X variable.
For instance, Y values might represent:
Sales
Exam scores
Growth rate
Revenue
3. Ensure Equal Data Points
Make sure that the number of X values matches the number of Y values, since each pair represents a single observation.
4. Click the Calculate Button
After entering your dataset, click the Calculate button. The calculator will instantly perform the regression analysis.
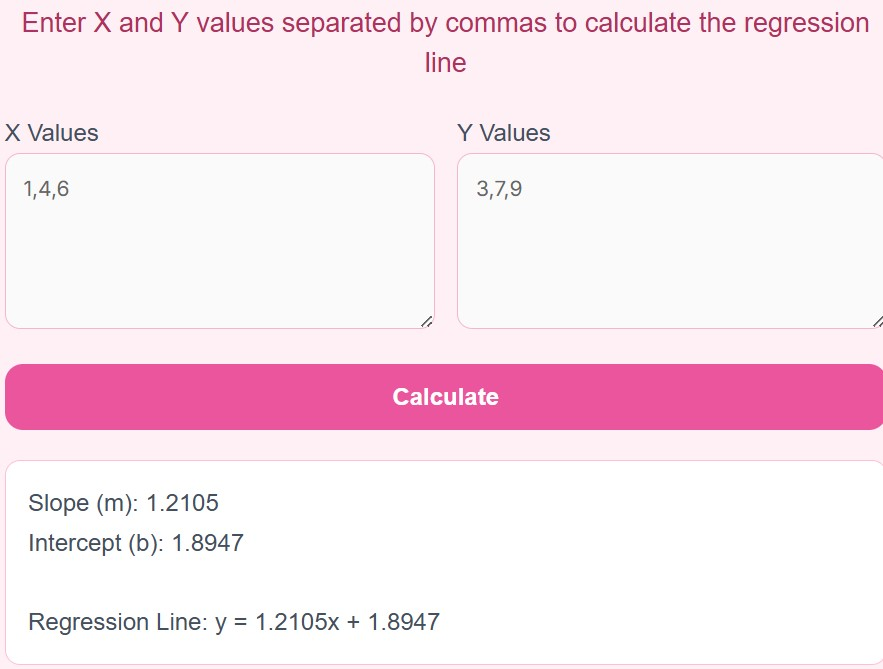
5. View the Results
The tool will generate the following outputs:
Slope (m) of the regression line
Y-Intercept (b)
Regression Equation
Predicted relationship between X and Y
These results help you understand how strongly one variable affects another.
Advantages of Using Least Squares Regression Line Calculator
The Least Squares Regression Line Calculator offers several benefits for students, researchers, and professionals who work with data.
1. Saves Time and Effort
Manual regression calculations involve multiple statistical formulas and can be time-consuming. This calculator simplifies the process and produces results instantly.
2. Accurate Statistical Analysis
The calculator eliminates the risk of human calculation errors by automatically applying the least squares formula.
3. Helpful for Students
Students studying statistics, mathematics, economics, or data science can easily verify their regression calculations using this tool.
4. Useful for Data Interpretation
Regression analysis helps users understand the relationship between variables, making it easier to identify patterns and trends.
5. Widely Applicable Across Fields
The least squares regression method is used in many industries, including:
Business analytics
Finance
Machine learning
Economics
Scientific research
6. Beginner Friendly
Even if you have little statistical knowledge, the calculator is easy to use. You simply enter your dataset, and the tool handles the mathematical computations.
7. Improves Decision Making
Businesses and researchers often rely on regression analysis to make data-driven decisions. By identifying relationships between variables, organizations can better predict outcomes.
FAQs
What is the least squares regression method?
The least squares method is a statistical technique used to find the best-fitting line for a dataset by minimizing the squared differences between observed and predicted values.
What is a regression line?
A regression line is a straight line that represents the relationship between two variables in a dataset. It is used to predict values and analyze trends.
What does the slope of a regression line represent?
The slope indicates how much the dependent variable (Y) changes when the independent variable (X) increases by one unit.
What does the intercept mean?
The y-intercept represents the value of Y when X is equal to zero. It shows where the regression line crosses the vertical axis.
Why is the least squares method important?
The least squares method is widely used because it provides the most accurate linear approximation of a dataset.
Can regression analysis predict future values?
Yes, regression lines can be used to predict future outcomes based on existing data trends. However, predictions may not always be perfectly accurate.
Who uses regression analysis?
Regression analysis is commonly used by:
Data analysts
Economists
Researchers
Engineers
Business professionals
Disclaimer
This calculator is intended for educational and informational purposes only and should not be considered professional statistical advice.
Results may vary depending on the dataset, so always verify critical calculations using reliable statistical methods or professional tools.