
Normal Probability Calculator for Sampling Distributions
Calculate probabilities for sampling distributions easily
What is Normal Probability Calculator for Sampling Distributions Calculator?
A Normal Probability Calculator for Sampling Distributions is a statistical tool designed to help users calculate probabilities related to sample means using the normal distribution. In statistics, when we take repeated samples from a population, the distribution of the sample means tends to follow a normal distribution this concept is known as the sampling distribution of the mean.
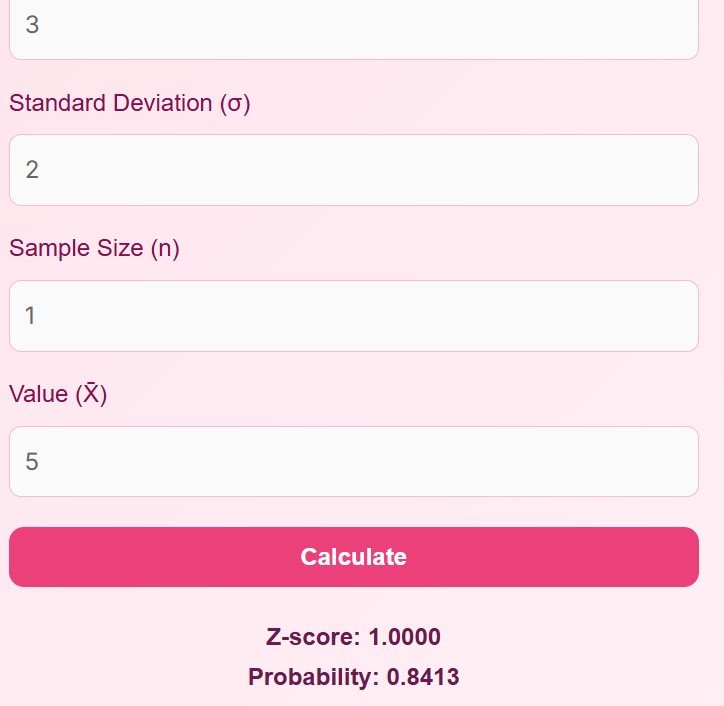
This calculator simplifies complex statistical formulas and allows users to quickly determine the probability of a sample mean falling below, above, or within a certain range. It uses key inputs such as population mean (μ), standard deviation (σ), sample size (n), and sample mean (X̄) to compute the Z-score and corresponding probability.
Whether you are a student, researcher, or data analyst, this calculator saves time and eliminates manual errors by providing instant and accurate results. It is especially useful in hypothesis testing, quality control, and data analysis where understanding sample behaviour is crucial.
Once you have the probabilities of each outcome, you can measure how uncertain the distribution is. Entropy Calculator turns a list of probabilities into an entropy in bits.
How to Use It
Using the Normal Probability Calculator for Sampling Distributions is simple and user-friendly. Follow these steps:
1. Enter Population Mean (μ)
Input the average value of the entire population. This is the central value around which your data is distributed.
2. Enter Standard Deviation (σ)
Provide the population standard deviation, which measures how spread out the data is.
3. Enter Sample Size (n)
Input the number of observations in your sample. A larger sample size generally leads to a more accurate estimate.
4. Enter Sample Mean (X̄)
Add the sample mean value for which you want to calculate the probability.
5. Click on Calculate
Once all values are entered, click the Calculate button. The tool will instantly compute:
- Z-score
- Probability value
6. Interpret the Result
- The Z-score shows how far your sample mean is from the population mean in terms of standard errors.
- The probability tells you how likely it is to observe that sample mean under normal conditions.
This tool is designed to be intuitive, so even beginners can easily perform statistical calculations without needing advanced knowledge.
Advantages
Using a Normal Probability Calculator for Sampling Distributions offers several benefits:
1. Saves Time
Manual calculations involving formulas like Z-score can be time-consuming. This calculator provides instant results, helping you work more efficiently.
2. Reduces Errors
Human errors in calculations are common, especially in statistics. This tool ensures accurate computations every time.
3. Beginner-Friendly
You don’t need to be an expert in statistics. The simple interface makes it easy for students and beginners to use.
4. Improves Understanding
By instantly showing results, users can better understand how changes in inputs affect probabilities and distributions.
5. Useful for Academic and Professional Work
This calculator is helpful for:
- Students solving assignments
- Researchers analyzing data
- Analysts performing statistical testing
6. No Installation Required
Since it works online, you can access it anytime from any device—desktop, tablet, or mobile.
7. Supports Decision Making
Understanding probabilities helps in making data-driven decisions in business, science, and research.
FAQs
1. What is a sampling distribution?
A sampling distribution is the probability distribution of a statistic (like the mean) obtained from multiple samples drawn from the same population.
2. Why does the sampling distribution follow a normal distribution?
According to the Central Limit Theorem, as the sample size increases, the distribution of sample means approaches a normal distribution, regardless of the population’s shape.
3. What is a Z-score?
A Z-score measures how many standard errors a sample mean is away from the population mean. It helps determine probability.
4. Can I use this calculator for small sample sizes?
Yes, but for very small samples, results may be less accurate unless the population is normally distributed.
5. What happens if I enter incorrect values?
The calculator will prompt you to enter valid numbers. Always double-check your inputs for accurate results.
6. Is this calculator suitable for hypothesis testing?
Yes, it can be used as a supporting tool in hypothesis testing by helping you compute probabilities and Z-scores.
7. Do I need internet access to use it?
If the calculator is embedded on your website, users will need internet access to load the page.
8. Can this calculator be used on mobile devices?
Yes, it is fully responsive and works smoothly on smartphones and tablets.
Disclaimer
This calculator is intended for educational and informational purposes only.
Results should not be used as a substitute for professional statistical analysis or decision-making.