
Coefficient of Determination Calculator
Enter your X and Y data points separated by commas to calculate the goodness of fit.
What is Coefficient of Determination Calculator?
In the world of statistics and data science, raw numbers often tell a complicated story. To make sense of the relationship between two variables, researchers use a metric called the Coefficient of Determination, or $R^2$. A Coefficient of Determination Calculator is a specialized digital tool designed to instantly measure how well a statistical model predicts an outcome.
Specifically, $R^2$ represents the proportion of the variance for a dependent variable that’s explained by an independent variable in a regression model. If you are looking at a scatter plot, the $R^2$ value tells you how “tightly” your data points cluster around the regression line. It is the gold standard for determining the “goodness of fit.”
Values for $R^2$ typically range from 0 to 1. A value of 0 indicates that the model explains none of the variability of the response data around its mean, while a value of 1 indicates that the model explains all the variability. Whether you are a student analyzing lab results or a business owner predicting sales trends based on advertising spend, this calculator simplifies the complex math into a single, understandable figure.
How to Use It
We have designed this calculator with a “Soft Pink” minimalist interface to ensure that your focus remains on the data, not a cluttered screen. Here is how you can get your results in seconds:
Prepare Your Data: Gather your paired data points. You will need an “X” set (the independent variable, like “hours of sleep”) and a “Y” set (the dependent variable, like “test scores”).
Input X Values: Type or paste your X data into the first text area. Ensure each number is separated by a comma (e.g., 10, 20, 30).
Input Y Values: Enter the corresponding Y data into the second box. It is crucial that the number of values in both boxes matches exactly.
Click Calculate: Hit the Calculate Coefficient button. The tool will process the sums of squares and correlation values instantly.
Read the Interpretation: The calculator won’t just give you a decimal; it will provide a brief summary of whether your correlation is strong, moderate, or weak.
Step by Step Calculation Example
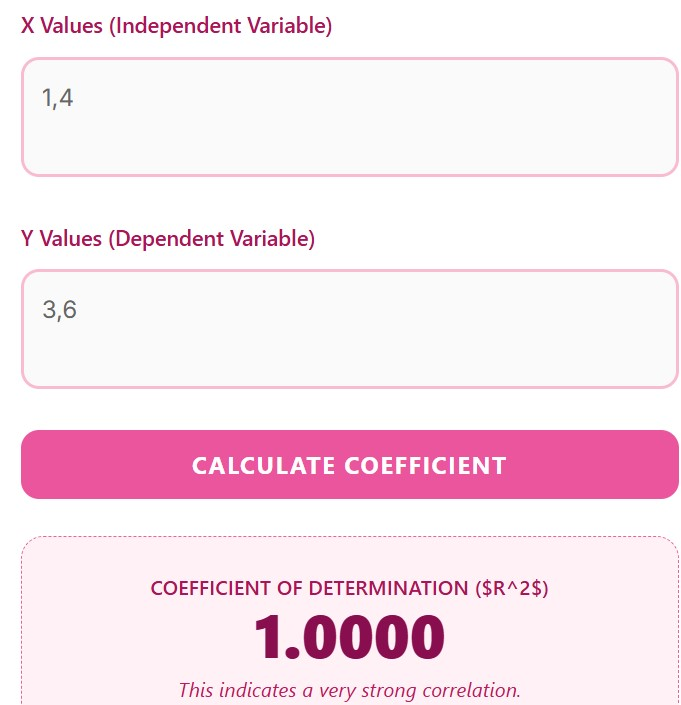
To understand how the Coefficient of Determination ($R^2$) is derived, let’s break down the math using the data from the screenshot:
X Values (Independent): 1, 4
Y Values (Dependent): 3, 6
Step 1: Calculate the Mean of X and Y
First, we find the average (mean) for both data sets:
Mean of X ($\bar{x}$): $(1 + 4) / 2 = 2.5$
Mean of Y ($\bar{y}$): $(3 + 6) / 2 = 4.5$
Step 2: Determine the Sum of Squares
We need to calculate how much each point deviates from the mean.
$SS_{xx}$ (Variance in X): $(1 – 2.5)^2 + (4 – 2.5)^2 = 2.25 + 2.25 = 4.5$
$SS_{yy}$ (Variance in Y): $(3 – 4.5)^2 + (6 – 4.5)^2 = 2.25 + 2.25 = 4.5$
$SS_{xy}$ (Covariance): $(1 – 2.5)(3 – 4.5) + (4 – 2.5)(6 – 4.5) = 2.25 + 2.25 = 4.5$
Step 3: Find the Correlation Coefficient ($r$)
Before getting $R^2$, we calculate the Pearson Correlation Coefficient ($r$) using this formula:
Step 4: Calculate the Coefficient of Determination ($R^2$)
Finally, we square the value of $r$ to find the Coefficient of Determination:
Interpretation of the Result
As shown in your calculator output, the result is 1.0000.
Perfect Relationship: This indicates that 100% of the variation in the Y values is explained by the X values.
Linear Accuracy: Because there are only two points, they naturally form a perfectly straight line, resulting in a “Very Strong Correlation.”
Advantages of Using Our Tool
Manually calculating the Coefficient of Determination involves complex formulas involving the Sum of Squares Total ($SS_{tot}$) and the Sum of Squares Residual ($SS_{res}$). Here is why using our online calculator is a better choice:
Error Free Computation: Statistics is prone to human error, especially when squaring large sets of numbers. Our tool uses a precise algorithm to ensure 100% accuracy.
Time Efficiency: What would take 15 minutes with a pencil and paper or 5 minutes in Excel takes less than a second here.
Mobile-Friendly Design: Unlike heavy statistical software, this calculator is fully responsive. You can run regression analysis on your smartphone or tablet during a meeting or in a classroom.
Unique Aesthetic: The soft pink theme provides a professional yet welcoming environment, reducing the “math anxiety” often associated with technical tools.
Contextual Results: We don’t just leave you with a number like 0.85; we explain what that number implies for your data’s relationship.
FAQs
1. What is considered a “good” $R^2$ value?
There is no universal “good” value. In physics, you might expect an $R^2$ of 0.99. However, in social sciences where human behavior is unpredictable, an $R^2$ of 0.30 might be considered quite significant.
2. Can the Coefficient of Determination be greater than 1?
No. Since $R^2$ is a ratio of explained variance to total variance (and the square of the correlation coefficient $r$), it must stay between 0 and 1.
3. What is the difference between $R$ and $R^2$?
$R$ is the correlation coefficient, which tells you the strength and direction (positive or negative) of a relationship. $R^2$ is the square of that value, which tells you the proportion of variance explained.
4. Why does my $R^2$ increase when I add more variables?
In multiple regression, $R^2$ almost always increases when more variables are added, even if they aren’t relevant. This is why some researchers prefer “Adjusted $R^2$.”
5. Does a high $R^2$ mean that X causes Y?
No. $R^2$ measures correlation, not causation. A high value shows a strong relationship, but it does not prove that one variable causes the other to change.
Disclaimer
This calculator is intended for educational use and general data analysis purposes only; results should be verified for critical research. The developer is not liable for any decisions made based on the output of this tool.